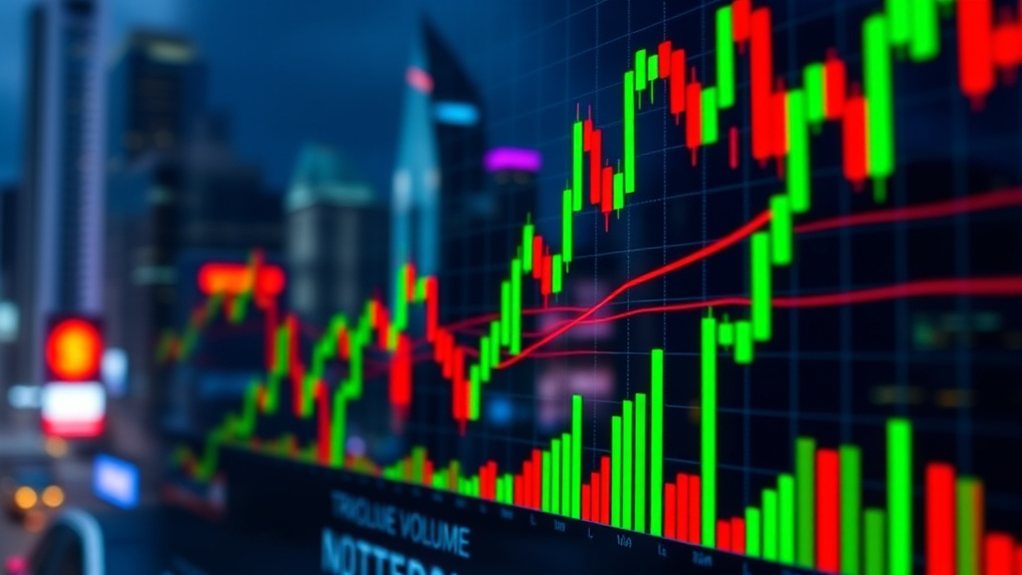
Trading volume refers to the total number of shares or contracts exchanged during a specific time period. It's a key indicator of market activity and liquidity. High volume suggests strong interest in a security, making it easier to buy or sell. Low volume may indicate uncertainty or lack of market interest. Traders follow volume patterns to confirm price movements and understand market sentiment. These patterns reveal essential insights about trading activity beneath the surface.

Trading volume is the total number of shares or contracts that change hands during a specific time period. It's one of the most vital measures of market activity and liquidity in financial markets. When investors trade stocks, bonds, options, futures, or commodities, each transaction contributes to the overall volume. This data is reported throughout the trading day as estimates, with final numbers typically available the following day.
Volume serves as a key indicator for traders and investors looking to understand market behavior. It reflects the level of interest in a particular security and shows how actively it's being traded. High trading volume means a security is liquid, making it easier to buy or sell without greatly impacting the price. This liquidity is essential for investors who need to enter or exit positions quickly.
Volume reveals market interest and trading activity, providing crucial liquidity for investors needing swift position changes.
The calculation of trading volume is straightforward. It's simply the sum of all trades for a specific security during a given timeframe. For stocks, volume is measured in shares, while for derivatives like options and futures, it's measured in contracts. Many investors track average daily trading volume to establish a baseline for normal trading activity.
Volume patterns can reveal important market insights. High volume often accompanies notable price movements, suggesting strong conviction behind the price change. Conversely, low volume may indicate uncertainty or lack of interest. Trading volume typically spikes at market open and close and can be higher at the beginning and end of the trading week. Institutional investors often need to sell shares gradually in markets with low liquidity to prevent significant losses from price slippage.
Traders use several specialized techniques to analyze volume. These include the volume price trend indicator, on-balance volume, accumulation/distribution line, volume-weighted average price, and money flow index. Each tool helps investors understand how volume relates to price movements and market sentiment. Traders can also use volume-by-timeframe analysis to examine trading activity over specific intervals like minutes, hours, or days.
In practical terms, volume helps confirm price trends and breakouts. When prices rise with increasing volume, it suggests strong buyer interest. If prices fall with high volume, it indicates selling pressure. Volume can also help identify potential market reversals when price and volume trends diverge.
Despite its usefulness, trading volume has limitations. It doesn't always predict future price movements and can be skewed by large institutional trades. Volume patterns vary in different market conditions and require context for proper interpretation. That's why professionals typically use volume alongside other technical indicators for a more complete market analysis.
Volume remains essential for understanding market dynamics. It helps investors gauge the strength of price movements and overall market sentiment. By monitoring trading volume, market participants gain valuable insights into the forces driving security prices in financial markets.
Frequently Asked Questions
How Does Trading Volume Affect Stock Prices?
Trading volume affects stock prices by indicating market interest and conviction. High volume during price increases suggests strong buying pressure, validating uptrends.
When prices fall with heavy volume, it shows significant selling pressure. Volume often leads price movements, with spikes frequently preceding major changes.
Low volume can create more volatile price swings. Analysts watch volume patterns closely, as they're key indicators of potential trend strength, continuations, or reversals.
What Causes Abnormal Spikes in Trading Volume?
Abnormal trading volume spikes typically result from major news like earnings surprises, mergers, or product announcements.
Market events such as index rebalancing, options expiration, or short squeezes can trigger heavy trading.
Economic factors including interest rate decisions or jobs reports often cause volume surges.
Technical breakouts or breakdowns may prompt traders to buy or sell en masse.
These spikes don't always signal price direction but confirm significant market interest.
Is High Trading Volume Always a Positive Indicator?
No, high trading volume isn't always positive.
While it often shows strong market interest and liquidity, it can also signal market tops or panic selling. High volume during price drops might indicate investors rushing to exit positions.
During market rallies, it can confirm buyer interest or suggest a potential reversal.
Traders shouldn't view volume in isolation but should consider it alongside price action and market context.
How Do Institutional Investors Impact Trading Volume?
Institutional investors drive most of today's trading volume. These large players, like hedge funds and pension funds, regularly execute massive trades of 10,000+ shares.
They use algorithms and high-frequency trading systems that generate countless transactions daily. Their activity creates liquidity in markets, making it easier for everyone to buy and sell.
When institutions move into or out of stocks together, they can dramatically increase volume and influence price trends.
Can Trading Volume Predict Market Crashes?
Trading volume can offer clues about potential market crashes, but it's not a perfect predictor. Research shows high trading volume often comes before market downturns.
When many investors suddenly buy or sell stocks, it might signal trouble ahead. However, volume spikes don't always lead to crashes.
Experts say volume should be considered alongside other factors like price patterns and investor sentiment for more reliable forecasting.


